Follow the Leaders
Roundtable Program for Key Executives Begins in October 2023
For years, our members have been asking for a peer learning experience for their second in command. We created a peer learning experience for COOs, GMs, number twos, etc., as a pilot program earlier this year. It was a great success and we are ready to offer the program to more key executives!
Learning with peers accelerates the abilities of professionals. We know that from decades of serving CEOs in this way.
VACEOs is offering a cohort-style program for key executives from small and medium sized businesses that will:
- Create meaningful connections with other professionals. A trusted network.
- Accelerate the learning and growth of these professionals by expanding their perspectives and exposing them to others’ experiences.
- Connect them with experts from the community in a wide range of disciplines.
The next session of Key Executive Roundtables will form roundtables of 8 to 10 executives, who will meet monthly from October 2023 to June 2024. These three-hour meetings will be led by a professional facilitator and consist of two elements.
- A confidential peer roundtable experience that gives everyone the chance to share issues and opportunities, and to learn from one another’s experiences. Essentially, a condensed version of our CEO Roundtables format.
- Learning from subject matter experts on topics like strategy, execution, culture, technology, compliance, finance, HR, marketing, sales, etc.
This is not a VACEOs membership, but a program that we are offering to key executives of both member and non-member firms. Participants are expected to commit to 100% attendance.
Cost for this program is $2,350 for VACEOs members’ key execs, and $2,650 for execs from non-member organizations. This fee is billed after acceptance.
You can apply here. Deadline for applications is September 8.
If you have any questions, please email info@vaceos.org.
Hyper Sales Growth

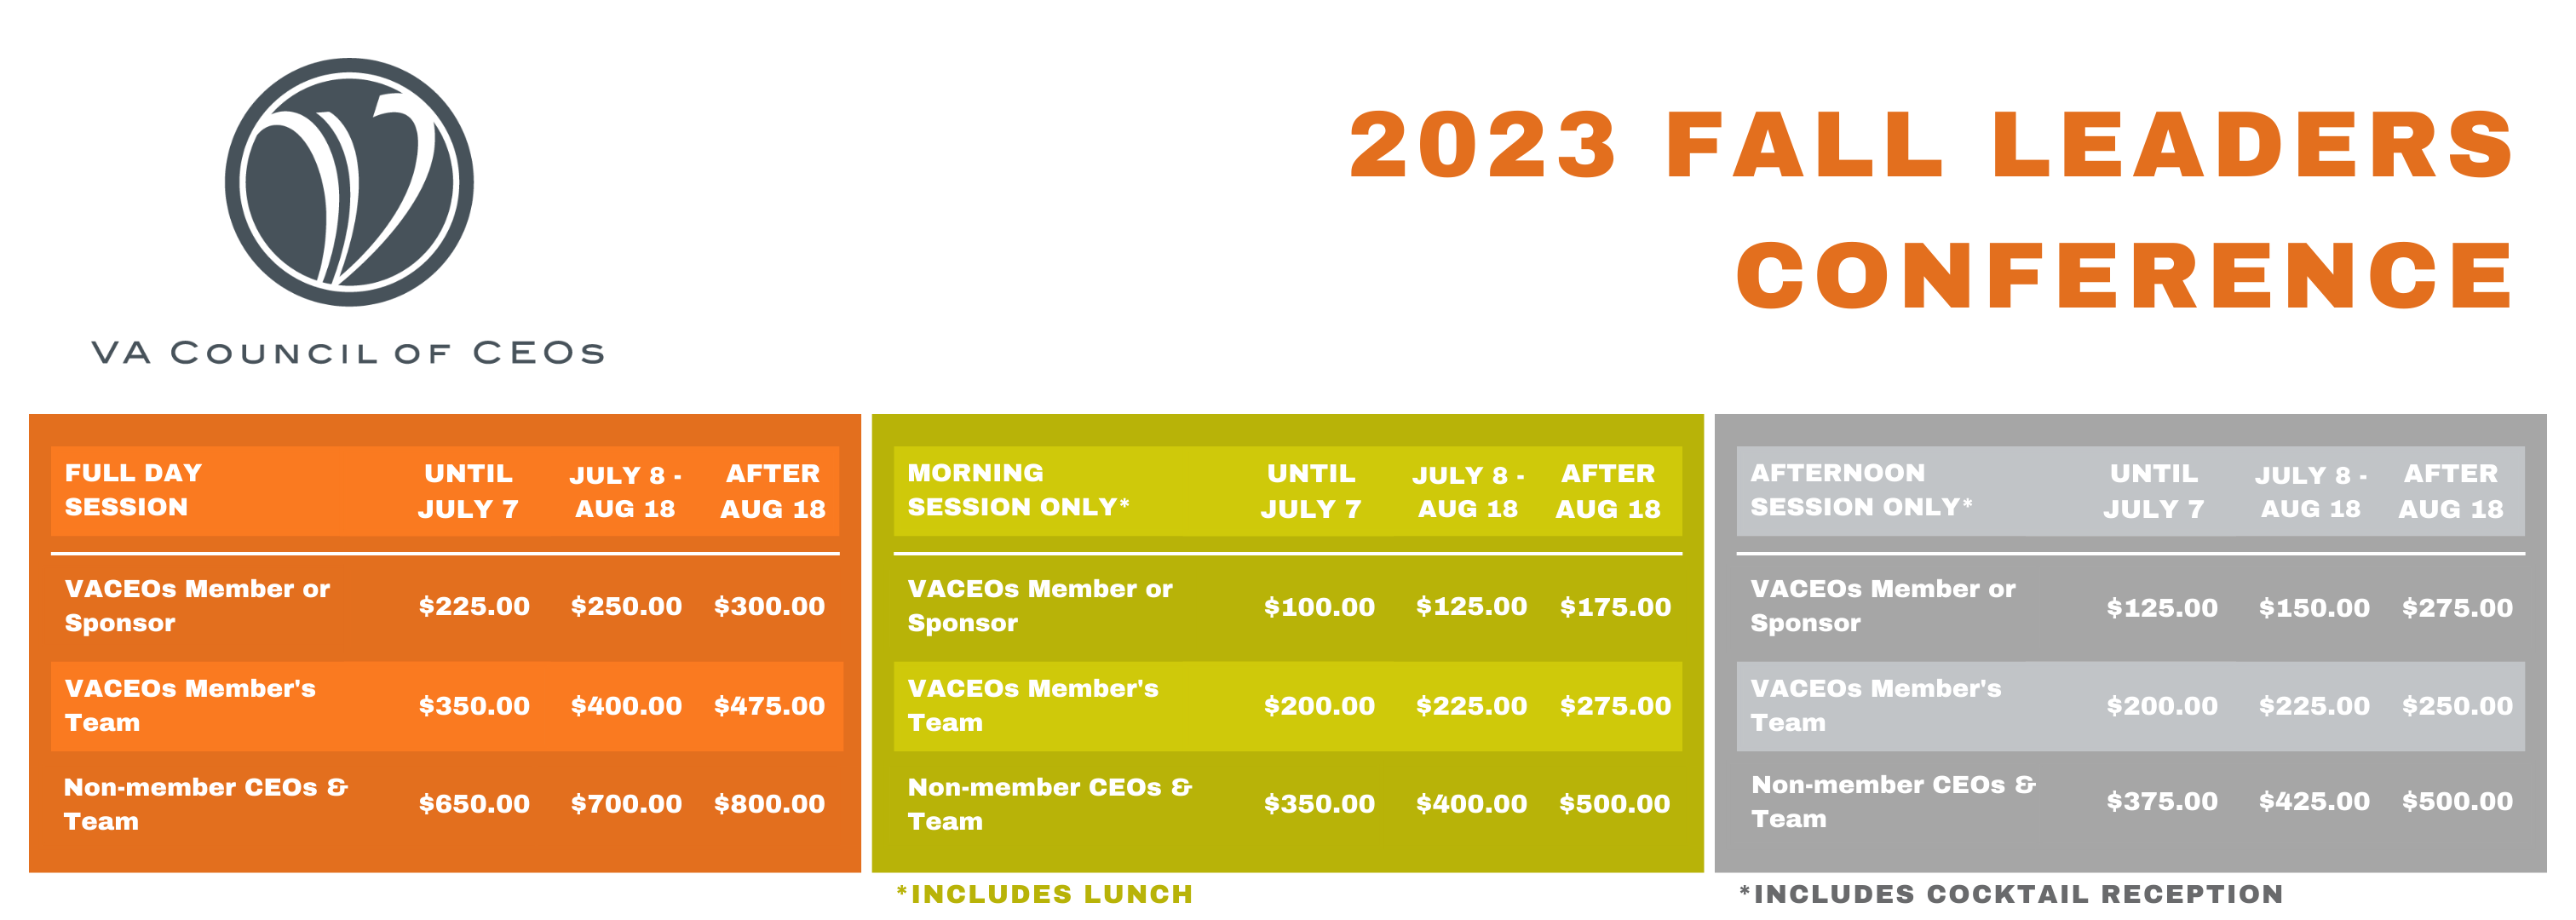
Bring your team! The Fall Leaders Conference is open to all leaders, not just VACEOs members.

Join VACEOs on September 21, 2023, at the University of Richmond to spend the day with Jack Daly – sales growth expert, world renowned speaker and bestselling author.
Get to the top of your sales game through Jack’s Smart Selling or Sales Management workshops.
Jack will show you how to apply street-tested techniques that will make the difference, as well as reinforce and provide accountability to ensure things are getting done in his Smart Selling workshop.
Learn effective ways to recruit, coach, and train your sales force with proven sales processes that when applied consistently ensure sales success in Jack’s Sales Management workshop.
Through these engaging and interactive sessions, you will learn what it takes to reach your full selling and management potential. Jack Daly will help you get there. To register, click HERE.
Sponsors
Sponsorship opportunities are available. Please contact Scot McRoberts to learn more.

To register now, click HERE.
Schedule for the day:
Thursday, September 21
8:30 AM – 9:00 AM: Registration
9:00 AM – 10:30 PM: Smart Selling
10:30 AM – 11:00 AM: Break
11:00 AM – 12:30: Smart Selling continues
12:30 PM – 1:30 PM: Lunch
1:30 PM – 3:00 PM: Sales Management
3:00 PM – 3:15 PM: Break
3:15 PM – 5:00 PM: Sales Management continues
5:00 PM – 6:00 PM: Cocktail Reception
Who is this for:
This program is open to all CEOs and their teams. Click HERE to register.

About the Speaker
Jack Daly is a leading sales speaker and trainer with over 30 years of sales and executive experience. Jack’s track record is a testament to his real-world knowledge and extensive expertise in sales and sales management. He started his professional journey at CPA firm Arthur Andersen and rose to the CEO level of several corporations, building six companies into national firms along the way, two of which he subsequently sold to the Wall Street firms of Solomon Brothers and First Boston.
In addition to his comprehensive professional background, Jack holds a BS in Accounting, as well as an MBA, and was a Captain in the U.S. Army. Jack Daly is an Amazon Best Selling Author and has written and contributed to many books, including Hyper Sales Growth and The Sales Playbook for Hyper Sales Growth. Jack is a 15-time Ironman competitor and has completed over 93 marathons in 50 states and on seven continents. He achieves these goals and lives life to the fullest by following his own Life by Design techniques.
Born and raised in Philadelphia, Jack currently resides in San Clemente, California.
Cashflow Forecasting – A Vital Tool for Your Business

Cash is the fuel of business. Run out of it, and your business engine shuts down, leaving you with a machine that doesn’t work.
For something so crucial to the life and success of a business, you would think it would be given more prominence in strategic planning and day-to-day decision-making, especially since important decisions with long-term financial impact are often made. And some of those decisions involve future investments, balloon payments, and contingencies. The best tool to predict and manage cash levels is a Cashflow Forecast.
Cashflow Forecasting not only helps prevent disasters but it also improves the speed and confidence in your business decisions. Specifically, this tool will:
- Improve your cash position by showing you which activities are producing cash.
- Help you with the cost-benefit analysis of increasing or creating a new business segment.
- Map a path to recovery in periods of crisis.
- Provide transparency to future operations by modeling out a variety of business scenarios.
Perhaps you have a Cashflow Forecast gathering dust on your CFO’s desk. That could be because you have enough of a cash position to absorb disruptions. It may not be scenario-based, unable to flex to changing circumstances, or model decision-making. It also could be because it took great effort to build and is challenging to update and adjust.
This article is written for small- to mid-sized organizations that use spreadsheet software, such as Excel, for their financial forecasting. The goal is to give you some best practices to consider in building a Cashflow Forecast. Hopefully, it will provide you some basic tenets on building that will make this a less frustrating experience.
Background
I used to think long-term forecasting was nice to have, but I did not see it make a big impact. Then life experiences (and a great mentor) showed me this tool’s true value and power; perhaps the following examples can help explain. The first time I was involved in long-term forecasting was during a period of leveraged business growth when we also aimed to double our days in cash. I’ve selectively used it to model the cash impact of a series of loan balloon payments. I’ve also used it to model the needed adjustments and survival from a set of mandated minimum wage increases, which was set to double our wage costs.
A few years back, I saw the tragic results of not having this tool. I was called to help an organization on the precipice of bankruptcy where the use of the tool could have saved them from making a series of fatal business decisions. Like their industry peers, they expanded their footprint but ignored their industry’s operating metrics and certainly did not have a handle on the impact to their cash position. Blindly, they ran out of cash and seemed shocked that it was happening. And my most powerful use of cash modeling was during the shutdown in 2020 during the COVID pandemic. Modeling out the weekly cash requirements, we were able to determine what we could afford to do during the shutdown. It kept us in control and allowed us to avoid a lot of damage by overreacting.
Building the Model
A good model takes planning and an understanding of your business. But if built with the goal of updating with actuals and multiple scenarios, it will save a lot of time down the road. With a regular update of actuals replacing forecasted periods, you will be able to measure progress and see trends. We recommend purchasing forecast software if your budget allows it. Although I have worked with a custom forecasting model, the bulk of my experience is working in Excel, a tool that is within reach of most businesses.
Time Periods – Interval and Length
The forecast interval can be monthly, yearly, or weekly. Often the bigger the disruption, the smaller the time intervals to focus on. During the freefall of cash due to the shutdown from COVID in 2020, we had weekly intervals forecasted. Monthly is the most common, with yearly totals. Daily is used more when a monitoring standpoint is needed and when cash is particularly tight.
The forecast length depends on the degree of change and the impact of future events. For instance, if you are a startup, going out for more than three years might not make much sense. Many strategic plans are for three to five years. Even with a three-year strategic plan, the extra two years can help model the changes that are happening in year three, for instance. If you have a major financial event, such as a purchase, financial payout, loan balloon, etc., that is six or seven years out; then it would be important to expand your forecast out to that event. If your business is investment intensive, taking the forecast out to that life cycle makes sense.
Modeling Scenarios
Scenario Planning is key to helping prepare for the future. Consider building a new product line, vertical growth, or territory expansion into your model. Another source is contingency modeling utilizing your work with an operational SWOT (Strengths, Weaknesses, Opportunities, and Threats) analysis.
Think about how your internal operating needs can direct the required modeling. Consider some of the following:
- Debt Financing Needs – will a planned purchase require financing?
- Debt Service – is there a balloon payment? Are payment levels sustainable?
- Capital projects – are acquisitions, major repairs, or equipment replacements on the horizon?
Consider external impacts from the economy or regulation.
- Inflation – how will it impact supply costs and wages?
- Recession – how are your revenues?
- Unemployment Levels – how does this affect your workforce?
- Monetary Policy – is there availability of funds to borrow?
- Interest Rates – how will they affect the affordability of financing variable rate debt?
- Government regulations and interference – are there anticipated changes to minimum wage and environmental laws (e.g., the recent plan to eliminate the use of fluorocarbons)?
Key Metrics
Your forecast will include estimated information based on past, current, and projected financial conditions. Those metrics will speak to the health of your company. In a forecast, they can show you trends and warn you if you are projected to fall outside of healthy levels. These vary and can be unique to your industry; some to consider are below. The power of the forecast is that it will show you positive and negative trends in these metrics.
- Product/Service breakeven
- Days or Months in Cash
- Fixed Charge Coverage
- Debt to EBITDA
- Current or Quick Ratio
- Altman Z score (bankruptcy predictor)
- Labor cost per hour
- Revenue per Direct FTE
- Industry Specific Metrics
Best Practices on the Build
When building the Cashflow Forecast model, you want to anticipate future updates and scenario building. If you research cash flow models, it will be a unique model that doesn’t resemble anything you currently have. Don’t overcomplicate it. Instead, leverage your existing systems and reports you already use. Start with an existing income statement and balance sheet from your accounting software. Those two statements will give you the building blocks. Have the income statement separate each major business segment. You could bring in a cash flow statement, but I think it is easier to build it by adding and subtracting the differences between cash and accrual basis.
Download these financials from your system and have your model feed from these reports. Call this your “data” or “input” tab in Excel. This is key because you want to be able to update your model with history and new budgets without starting from scratch or manually keying in this information to update. Alternatively, with a fixed format, a cut-and-paste method can be just as effective.
Our preference is that the sections of the Cashflow Forecast model first start with rows of variables, second the income statement, third balance sheet, fourth cash basis adjustments, and at the bottom key metric calculations. The top rows of variables are fields that the model will feed from. For instance, interest rates, margins, inflation rates, wage increase rates, etc. Having these on separate tabs is possible, but I like having them all on one tab labeled “Detailed CFM.”
Build a Summary tab that condenses the information from the “Detailed CFM” tab. This will give you a summary view of the key information the detailed model produces. This can be any number of key drivers, such as cash balances, days in cash, topline revenues, net income, wage costs/ratios, margins, etc. Build your variables on this Summary tab and have the Detailed CFM reference them. This would let you change variables, such as inflation or price increases, on the Summary tab and instantly see the results.
Conclusion
Use this article as a roadmap that can be customized for your systems. Update it as needed but try for every six months. Model a scenario. It’s a model that will increase in functionality and power. The more you exercise its use, the stronger it will become. You will find that it will be a very popular report for your management team, bankers, and board. But there is a warning; if you tell these groups you have it, they will want to see it.
Helen Dow joined Warren Whitney as Director of Warren Whitney. She has over 30 years of experience helping companies improve their financial performance and enhance all finance and accounting functions. Helen generally serves Warren Whitney’s clients in the role of Fractional CFO/Controller. To learn how Helen or our other consultants can support your business, contact Stephanie Ford at sford@warrenwhitney.com or 804.282.9566.


Virginia CEOs Concerned by Increasing Interest Rates and Bank Failures
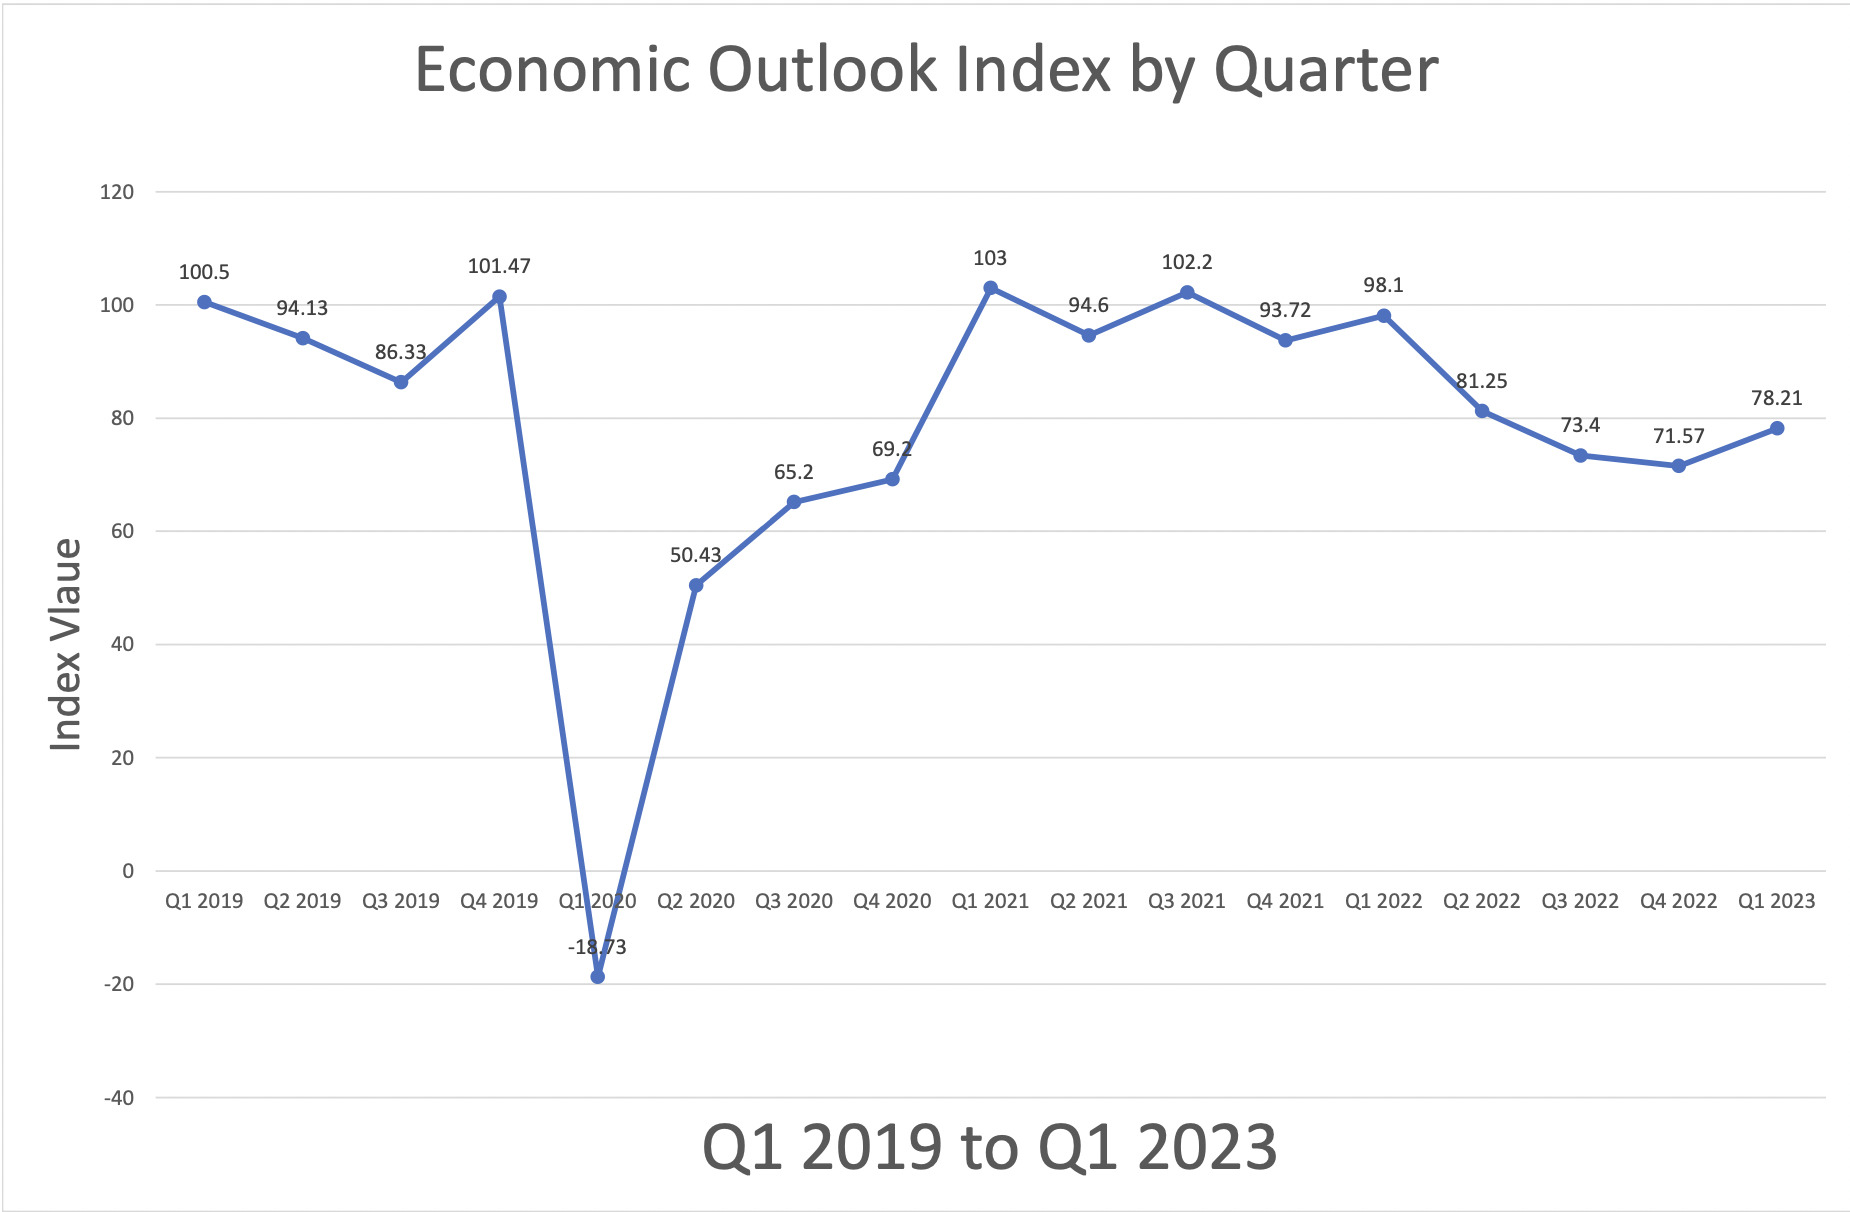
While interest rate increases and bank failures concern Virginia SMB CEOs, their economic outlook is rebounding for the first time since Q1 of 2022.
That’s the latest from the quarterly CEO Economic Outlook Survey conducted by the University of Richmond’s Robins School of Business and the Virginia Council of CEOs.
- 49% of CEOs indicate that the rapid rise in interest rates has negatively impacted their business, while only 2% indicate that the interest rate increases have positively impacted their business.
- 31% of CEOs have at least considered changing their banking practices due to the recent bank failures.
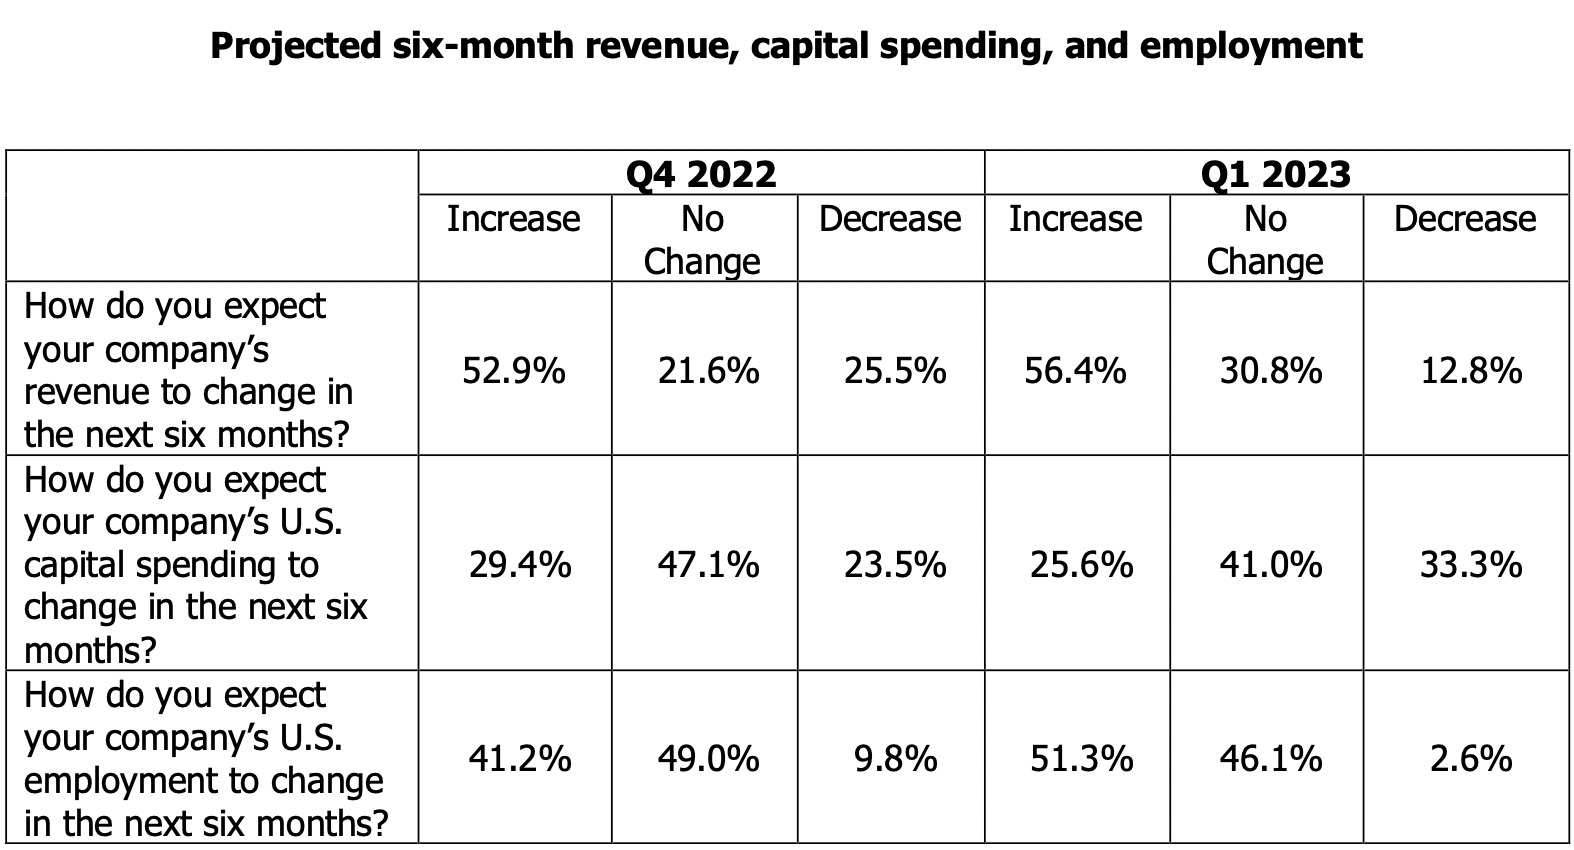
- 56% of CEOs expect revenue to increase with 30% expecting at least a 10% increase, while 51% expect employment to increase over the next six months.
The survey also found expectations over the next six months for revenue and employment were both positive and expected to grow faster than predictions from last quarter. Expectations with regard to capital spending remained primarily flat.
“The survey results suggest that CEOs see a more positive future than they have for the last 12 months. They have also felt a negative impact from the recent rise in interest rates,” said Rich Boulger, associate dean at the Robins School, who administers the survey and collects the responses. “The overall index is up for the first time in 12 months.”
More than half (56%) of CEOs indicated that they expect revenue to increase over the next six months.
- 5% expected revenue to be “significantly higher.”
- 51% expected revenue to be “higher.”
- 13% expected revenue to be “lower.”
- 31% indicated they expected no change.
About a quarter of CEOs (26%) expect capital spending to increase over the next six months (down slightly from last quarter), while 33% expect capital spending to decrease. More than 41% expect capital spending to remain flat.
Half of respondent CEOs (51%) expect employment to increase over the next six months. Additionally, 46% expect employment to remain flat while only 3% expect employment to fall.
Taken as a whole, the results pertaining to revenue, capital spending, and employment are more positive than any quarter since Q1 2022 with the overall Economic Outlook Index increasing (78.2 versus 71.6) relative to the results from the end of Q4 2022.
Additionally, CEOs were asked how the recent interest rate increases (from 0.25% to 5% over the last 12 months) have impacted their business. They reported:
- Little to no impact: 49%
- Negative impact: 49%
- Positive impact: 2%
They were also asked how the recent bank failures have impacted their banking practices. They reported the following:
- After evaluation, comfortable with current banking practices: 69%
- Have considered switching banks but have not: 23%
- Have made some major change to banking practices: 8%
“I think the continued optimism reflected in this survey represents the nimbleness of these small business CEOs. While most are concerned over higher interest rates, they have been able to adapt and continue to grow,” said Scot McRoberts, executive director of VACEOs.
The Robins School and VACEOs jointly conduct the quarterly survey, which regularly asks about expectations for revenue, capital spending, and employment, plus other relevant issues, helping Virginia companies anticipate business conditions and plan for growth. The Robins School adapted the survey from the Business Roundtable, an association of CEOs of American companies that conducts a similar survey nationally. Rich Boulger, associate dean at the Robins School, administers the survey and collects the responses. The quarterly survey has been administered since 2010.
Thirty-Nine CEOs responded to the survey, which was administered April 4 – 11. Multiple industries are represented in the sample although services and financial services represented the majority of the respondents. The average company whose CEO responded to this survey had about $10 million in revenue for the most recent 12-month period. The average employment was 56.
Recent Comments